East Phillips, Minneapolis facts for kids
Quick facts for kids
East Phillips
|
|
|---|---|
|
Neighborhood
|
|

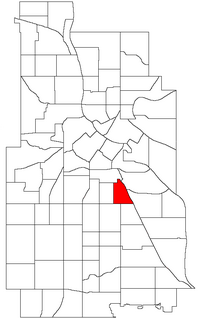
Location of East Phillips within the U.S. city of Minneapolis
|
|
| Country | United States |
| State | Minnesota |
| County | Hennepin |
| City | Minneapolis |
| Community | Phillips |
| Founded | 1849 |
| City Council Ward | 9 |
| Population
(2020)
|
|
| • Total | 4,904 |
| Time zone | UTC-6 (CST) |
| • Summer (DST) | UTC-5 (CDT) |
| ZIP code |
55404, 55407
|
| Area code(s) | 612 |
| Historical population | |||
|---|---|---|---|
| Census | Pop. | %± | |
| 2000 | 4,147 | — | |
| 2010 | 4,269 | 2.9% | |
| 2020 | 4,904 | 14.9% | |
East Phillips is a neighborhood within the Phillips community in the US city of Minneapolis, Minnesota. Its northern boundary runs along East 24th Street from Bloomington Avenue to 17th Avenue South, then runs along East 22nd Street from 17th Avenue South to Little Earth Trail and Hiawatha Avenue. Its other boundaries are Hiawatha Avenue to the east, East Lake Street to the south, and Bloomington Avenue to the west. It is a part of Ward 9, currently represented by city council member Jason Chavez.
The Phillips community has only been subdivided into smaller neighborhoods within the last decade; the boundaries of East Phillips were officially designated on December 23, 2005. As this change has been fairly recent, most residents still refer to the area as just "Phillips". The neighborhood also features the Little Earth residential community.
History
In 2014, residents of the neighborhood formed the East Phillips Neighborhood Institute (EPNI) to address several pollutant concerns and the risks of proposed construction projects in the community. Throughout 2023, EPNI's activism was largely publicized for its involvement in Minneapolis' proposed Roof Depot project.
Demographics
As of 2020, the population of East Phillips was 4,904, split 51.8% male and 48.2% female. 60.1% of residents were at least a high school graduate (or equivalent), and 22.5% had earned a bachelor's degree or higher.
29.7% of the population were foreign-born residents, and 55.9% spoke a language other than English at home. 23.9% of residents spoke English less than "very well".
36.4% of households had no access to a vehicle. Among workers 16 years and older, 56.0% commuted to work via car, 18.0% used public transit, and 26.0% walked, biked, worked at home, or used some other method. The medium household income in East Phillips was $47,139. 30.1% of residents lived below the poverty line, and 6.7% were unemployed. 51.2% of housing in the neighborhood was renter-occupied.
| Race/ethnicity | Share of total population (2020) |
|---|---|
| Total | 100% |
| One race | 96.3% |
| White | 15.4% |
| Black or African American | 28.5% |
| American Indian and Alaska Natives | 15.1% |
| Asian | 3.1% |
| Hispanic | 33.7% |
| Native Hawaiian and Other Pacific Islander | <0.1% |
| Other | 0.7% |
| Two or more races | 3.7% |

