Como, Minneapolis facts for kids
Quick facts for kids
Como
|
|
|---|---|
|
Neighborhood
|
|
 |
|
| Nickname(s):
Southeast Como
|
|

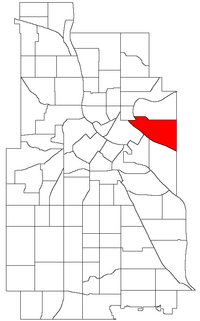
Location of Como within the U.S. city of Minneapolis
|
|
| Country | United States |
| State | Minnesota |
| County | Hennepin |
| City | Minneapolis |
| Community | University |
| Founded | 1882 |
| City Council Wards | 1, 2, 3 |
| Area | |
| • Total | 1.123 sq mi (2.91 km2) |
| Population
(2020)
|
|
| • Total | 6,455 |
| • Density | 5,748.0/sq mi (2,219.3/km2) |
| Time zone | UTC-6 (CST) |
| • Summer (DST) | UTC-5 (CDT) |
| ZIP code |
55414
|
| Area code(s) | 612 |
| Historical population | |||
|---|---|---|---|
| Census | Pop. | %± | |
| 1980 | 5,083 | — | |
| 1990 | 5,617 | 10.5% | |
| 2000 | 5,691 | 1.3% | |
| 2010 | 6,288 | 10.5% | |
| 2020 | 6,455 | 2.7% | |
Como is a neighborhood within the Southeast quadrant of Minneapolis. The neighborhood is also sometimes referred to as Southeast Como to help differentiate it from the Como Park neighborhood in neighboring Saint Paul. Its boundaries are East Hennepin Avenue to the north, 33rd Avenue Southeast (the eastern city limit) to the east, the Southeast Industrial Area to the south, and Interstate 35W to the west. Como is also part of the University District in Minneapolis, with its location near the main Minneapolis campus of the University of Minnesota.
Como features many amenities for its residents: Van Cleve Park Community Center, the Como Student Community Co-op, the University Childcare Center, Dar Al-Farooq mosque, SE Christian Church, and the Como Congregational Church building (designed in 1886 by Charles Sedgwick). The renovated Bunge grain elevator site's tower is the visual landmark for Como and is represented in the neighborhood's logo.
Geography and Civics
Como is primarily in Minneapolis City Council Ward 2, represented by Robin Wonsley. The northern portion of the neighborhood is in Ward 1, represented by Elliott Payne, and western edge is in Ward 3, represented by Michael Rainville. It also falls into the 2nd Police Precinct.
Como is served by Metro Transit Route 3, which connects the area to Downtown Minneapolis, all of the University of Minnesota-Twin Cities campuses, and Downtown St. Paul.
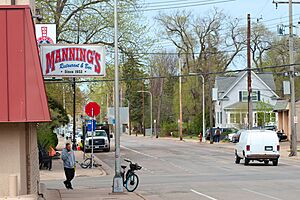
The high-traffic business roads, industrial zones, and active railroads that surround Como contrast sharply with the residential character of the core Como neighborhood. The housing stock consists of modest early 20th-century bungalows and Victorian and twenties-era homes mixed with a scattering of newer duplexes and single family homes. Some areas (e.g. along Como, 15th and Hennepin Avenues) have post-60's two-story walk-up apartment buildings.
Commercial activity is focused on Como and East Hennepin Avenues. The neighborhood is served by a services business hub along Como Avenue with grocery stores, dentist, barber shop, coffee houses, restaurants, and an auto service station.
Demographics
As of 2020, the population of Como was 6,455, split 58.1% male and 41.9% female. Over 95% of residents were at least a high school graduate (or equivalent), and 69.6% had earned a bachelor's degree or higher.
17.4% of the population were foreign-born residents, and 20.1% spoke a language other than English at home. According to the American Community Survey 5-year estimates (2016-2020), the top non-English languages spoken in Como were Spanish (spoken by 10.5% of the population), Hmong (1.5%), Vietnamese (1.3%), Somali (1.1%), and Russian (0.6%). 7.7% of residents spoke English less than "very well".
8.4% of households had no access to a vehicle. Among workers 16 years and older, 54.2% commuted to work via car, 22.1% used public transit, and 23.7 walked, biked, worked at home, or used some other method. The average household income in Como was $64,333. 38.7% of residents lived below the poverty line, and 5.3% were unemployed. 79.4% of housing in the neighborhood was renter-occupied.
| Race/ethnicity | ||||||
|---|---|---|---|---|---|---|
| 2000 | 2010 | 2020 | ||||
| Number | % | Number | % | Number | % | |
| White alone | 4,449 | 78.2 | 4,496 | 71.5 | 4,445 | 68.9 |
| Black alone | 312 | 5.5 | 622 | 9.9 | 747 | 11.6 |
| Hispanic or Latino (any race) | 168 | 3.0 | 203 | 3.2 | 399 | 6.2 |
| Native American alone | 70 | 1.2 | 104 | 1.7 | 51 | 0.8 |
| Asian alone | 540 | 9.5 | 638 | 10.1 | 740 | 11.5 |
| Pacific Islander alone | 3 | 0.0 | 1 | 0.0 | 0 | 0.0 |
| Other race alone | 15 | 0.3 | 25 | 0.4 | 27 | 0.4 |
| Two or more races | 134 | 2.4 | 187 | 3.0 | 380 | 5.9 |
| Total | 5,691 | 100.0 | 6,288 | 100.0 | 6,455 | 100.0 |

