Cheneyville, Louisiana facts for kids
Quick facts for kids
Cheneyville, Louisiana
|
|
|---|---|
|
Town
|
|
| Town of Cheneyville | |
 |
|

Location of Cheneyville in Rapides Parish, Louisiana.
|
|

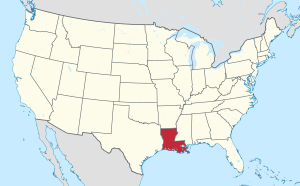
Location of Louisiana in the United States
|
|
| Country | United States |
| State | Louisiana |
| Parish | Rapides |
| Area | |
| • Total | 1.02 sq mi (2.63 km2) |
| • Land | 1.02 sq mi (2.63 km2) |
| • Water | 0.00 sq mi (0.00 km2) |
| Elevation | 62 ft (19 m) |
| Population
(2020)
|
|
| • Total | 468 |
| • Density | 460.63/sq mi (177.82/km2) |
| Time zone | UTC-6 (CST) |
| • Summer (DST) | UTC-5 (CDT) |
| Area code(s) | 318 |
| FIPS code | 22-14660 |
| GNIS feature ID | 2406260 |
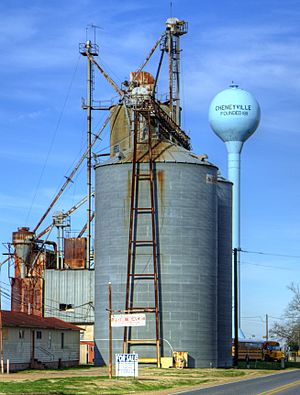
Cheneyville is a town in Rapides Parish, Louisiana, United States. It is part of the Alexandria, Louisiana Metropolitan Statistical Area. The population was 625 at the 2010 census.
History
The town was named for settler William Cheney.
Cheneyville is significant in the history of the Restoration Movement associated with Alexander Campbell. In 1843 most of the membership of a Baptist congregation, under the leadership of William Prince Ford, who had been influenced by Campbell's writings, became a Church of Christ. The Cheneyville Christian Church is the oldest congregation associated with the Restoration Movement in Louisiana. In 1857, Campbell visited the congregation and was favorably impressed by its fellowship between the races.
Ford is also known as the original enslaver of Solomon Northup, the main character in the feature film, Twelve Years a Slave. Northup was an African-American who had been born free, but kidnapped in Washington, D.C., and sold to Ford in New Orleans in 1841.
Notable people
- C. H. "Sammy" Downs lived in Cheneyville.
- Wilbur Dyer, state representative from south Rapides Parish from 1974 to 1980
- Sue Eakin, author and editor of Twelve Years a Slave.
- Leroy Augustus Stafford, a Rapides Parish planter and brigadier general in the Confederate Army.
Geography
According to the United States Census Bureau, Cheneyville has a total area of 1.0 square mile (2.6 km2), all land.
Demographics
| Historical population | |||
|---|---|---|---|
| Census | Pop. | %± | |
| 1910 | 498 | — | |
| 1920 | 678 | 36.1% | |
| 1930 | 835 | 23.2% | |
| 1940 | 913 | 9.3% | |
| 1950 | 918 | 0.5% | |
| 1960 | 1,037 | 13.0% | |
| 1970 | 1,082 | 4.3% | |
| 1980 | 865 | −20.1% | |
| 1990 | 1,005 | 16.2% | |
| 2000 | 901 | −10.3% | |
| 2010 | 625 | −30.6% | |
| 2020 | 468 | −25.1% | |
| U.S. Decennial Census | |||
2020 census
| Race | Number | Percentage |
|---|---|---|
| White (non-Hispanic) | 121 | 25.85% |
| Black or African American (non-Hispanic) | 320 | 68.38% |
| Other/Mixed | 22 | 4.7% |
| Hispanic or Latino | 5 | 1.07% |
As of the 2020 United States census, there were 468 people, 275 households, and 156 families residing in the town.
See also
 In Spanish: Cheneyville para niños

