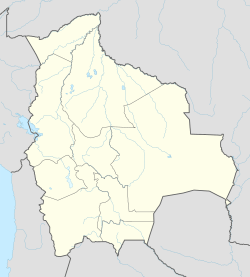
Challapata facts for kids
Quick facts for kids
Challapata
Ch'allapata
|
|
|---|---|
|
Town
|
|
| Country | |
| Department | Oruro Department |
| Province | Eduardo Abaroa Province |
| Municipality | Challapata Municipality |
| Canton | Challapata Canton |
| Elevation | 12,264 ft (3,738 m) |
| Population
(2012)
|
|
| • Total | 12,684 |
| Time zone | UTC-4 (BOT) |
Challapata is the capital of the Eduardo Abaroa Province as well as of the Challapata Municipality in the Oruro Department in Bolivia. It lies at an altitude of 3,738 m above sea level on the edge of the 250-acre (1.0 km2) flood plain of the river on the east bank of the Tacagua Poopó Lake. Challapata is located half way of the road and railway connection from Oruro to Potosí, about 130 kilometers from both cities. Directly southeast of the city rises the Cerro Azanaques, with 5102 m the highest peak in the Azanaques Mountain Range (Cordillera de Azanaques).
Contents
Geography
Challapata is located on the eastern edge of the Bolivian Altiplano before the Cordillera Azanaques, which is a part of the mountain chain of the Cordillera Central. The mean average temperature of the region lies at 8-9 °C (see climate diagram) and varies between 4 °C in June and July and 11 °C in December. The annual rainfall is about 350 mm, up to a pronounced dry season from April to October with monthly rainfall below 15 mm, and significant rainfall from December to March only 60 to 80 mm monthly rainfall.
Climate
| Climate data for Challapata, elevation 3,744 m (12,283 ft) | |||||||||||||
|---|---|---|---|---|---|---|---|---|---|---|---|---|---|
| Month | Jan | Feb | Mar | Apr | May | Jun | Jul | Aug | Sep | Oct | Nov | Dec | Year |
| Mean daily maximum °C (°F) | 18.2 (64.8) |
18.1 (64.6) |
18.1 (64.6) |
17.6 (63.7) |
15.5 (59.9) |
13.8 (56.8) |
14.0 (57.2) |
15.7 (60.3) |
17.3 (63.1) |
18.8 (65.8) |
19.7 (67.5) |
19.3 (66.7) |
17.2 (62.9) |
| Daily mean °C (°F) | 12.0 (53.6) |
11.7 (53.1) |
11.5 (52.7) |
9.8 (49.6) |
6.8 (44.2) |
4.7 (40.5) |
4.7 (40.5) |
6.6 (43.9) |
8.8 (47.8) |
10.4 (50.7) |
11.7 (53.1) |
12.2 (54.0) |
9.2 (48.6) |
| Mean daily minimum °C (°F) | 5.8 (42.4) |
5.3 (41.5) |
4.9 (40.8) |
2.0 (35.6) |
−1.9 (28.6) |
−4.5 (23.9) |
−4.6 (23.7) |
−2.4 (27.7) |
0.4 (32.7) |
1.9 (35.4) |
3.8 (38.8) |
5.1 (41.2) |
1.3 (34.4) |
| Average precipitation mm (inches) | 108.4 (4.27) |
88.4 (3.48) |
47.4 (1.87) |
14.7 (0.58) |
5.3 (0.21) |
2.9 (0.11) |
1.5 (0.06) |
3.5 (0.14) |
13.8 (0.54) |
14.2 (0.56) |
24.2 (0.95) |
61.1 (2.41) |
385.4 (15.18) |
| Average precipitation days | 13.7 | 11.9 | 8.4 | 2.4 | 1.2 | 0.6 | 0.4 | 0.8 | 2.0 | 2.5 | 4.2 | 8.8 | 56.9 |
| Average relative humidity (%) | 64.8 | 62.6 | 61.7 | 56.8 | 51.6 | 51.6 | 54.7 | 49.4 | 48.6 | 47.7 | 50.7 | 58.0 | 54.9 |
| Source: Servicio Nacional de Meteorología e Hidrología de Bolivia | |||||||||||||
Population
The population of Challapata has risen in the past two decades by nearly 50 percent: 1992: 6661 inhabitants (census) 2001: 7683 inhabitants (census) 2010: 9482 inhabitants (update)
See also
 In Spanish: Challapata para niños


