Castle Dale, Utah facts for kids
Quick facts for kids
Castle Dale, Utah
|
|
|---|---|

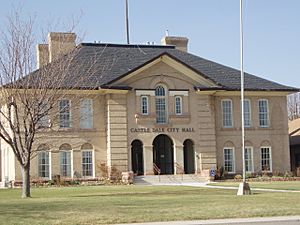
Castle Dale's city hall
|
|

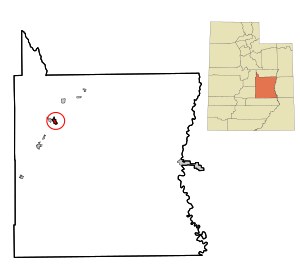
Location within Emery County and the State of Utah
|
|

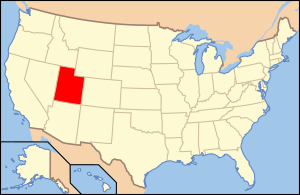
Location of Utah in the United States
|
|
| Country | United States |
| State | Utah |
| County | Emery |
| Settled | 1877 |
| Incorporated | 1920 |
| Area | |
| • Total | 2.23 sq mi (5.79 km2) |
| • Land | 2.23 sq mi (5.79 km2) |
| • Water | 0.00 sq mi (0.00 km2) |
| Elevation | 5,676 ft (1,730 m) |
| Population
(2020)
|
|
| • Total | 1,492 |
| • Density | 669.1/sq mi (257.69/km2) |
| Time zone | UTC-7 (Mountain (MST)) |
| • Summer (DST) | UTC-6 (MDT) |
| ZIP code |
84513
|
| Area code(s) | 435 |
| FIPS code | 49-10660 |
| GNIS feature ID | 1426380 |
Castle Dale is a city in northwestern Emery County, Utah, United States. The population was 1,492 at the 2020 census. It is the county seat of Emery County.
History
The first settlement at Castle Dale was made in 1879.
Geography
Castle Dale lies on the north side of Cottonwood Creek, a tributary of the San Rafael River, in Castle Valley.
According to the United States Census Bureau, the city has a total area of 2.2 square miles (5.6 km2), all land.
Utah State Route 10 passes through the center of town, leading northeast 31 miles (50 km) to Price and southwest 37 miles (60 km) to Interstate 70.
Demographics
| Historical population | |||
|---|---|---|---|
| Census | Pop. | %± | |
| 1890 | 505 | — | |
| 1900 | 559 | 10.7% | |
| 1910 | 693 | 24.0% | |
| 1920 | 715 | 3.2% | |
| 1930 | 713 | −0.3% | |
| 1940 | 841 | 18.0% | |
| 1950 | 715 | −15.0% | |
| 1960 | 617 | −13.7% | |
| 1970 | 541 | −12.3% | |
| 1980 | 1,910 | 253.0% | |
| 1990 | 1,704 | −10.8% | |
| 2000 | 1,657 | −2.8% | |
| 2010 | 1,630 | −1.6% | |
| 2020 | 1,492 | −8.5% | |
| U.S. Decennial Census | |||
As of the census of 2000 there were 1,657 people, 508 households, and 420 families residing in the city. The population density was 887.5 people per square mile (342.1/km2). There were 618 housing units at an average density of 331.0 per square mile (127.6/km2). The racial makeup of the city was 95.47% White, 0.06% African American, 0.66% Native American, 0.54% Asian, 0.18% Pacific Islander, 0.91% from other races, and 2.17% from two or more races. Hispanic or Latino of any race were 2.17% of the population.
Castle Dale has a sizable Afghan community, making up 11.4% of its population as of 2021.
There were 508 households, out of which 49.2% had children under the age of 18 living with them, 72.6% were married couples living together, 7.1% had a female householder with no husband present, and 17.3% were non-families. 15.6% of all households were made up of individuals, and 7.9% had someone living alone who was 65 years of age or older. The average household size was 3.22, and the average family size was 3.60.
In the city, the population was spread out, with 37.2% under 18, 9.7% from 18 to 24, 23.5% from 25 to 44, 21.5% from 45 to 64, and 8.1% who were 65 years of age or older. The median age was 28 years. For every 100 females, there were 105.8 males. For every 100 females aged 18 and over, there were 100.4 males.
The median income for a household in the city was $44,185, and the median income for a family was $48,603. Males had a median income of $40,515 versus $20,294 for females. The per capita income for the city was $14,175. About 6.7% of families and 9.5% of the population were below the poverty line, including 12.4% of those under age 18 and 5.6% of those aged 65 or over.
Climate
Castle Dale has a fairly typical Intermountain West cool semi-arid climate (Köppen BSk). Summer afternoons are hot with intense sunshine, although mornings are pleasantly cool, while winter mornings are frigid even though all but 14.2 afternoons top freezing in an average year. Precipitation, owing to the rain shadows of mountains to the south (blocking monsoonal storms in summer) and west (blocking Pacific storms in winter), is light throughout the year, although there is a slight peak in late summer. The wettest month since record began has been October 2006 with 3.80 inches or 96.5 millimetres, the wettest calendar year 1965 with 14.28 inches or 362.7 millimetres, and the driest 1956 with 3.87 inches or 98.3 millimetres. The dryness of the climate limits snowfall to 16.6 inches or 0.42 metres, with the snowiest month being January 1980 with 24.2 inches or 0.61 metres, and the snowiest year from July 1936 to June 1937 with 47.0 inches or 1.19 metres.
| Climate data for Castle Dale 1991-2020, extremes 1899- | |||||||||||||
|---|---|---|---|---|---|---|---|---|---|---|---|---|---|
| Month | Jan | Feb | Mar | Apr | May | Jun | Jul | Aug | Sep | Oct | Nov | Dec | Year |
| Record high °F (°C) | 67 (19) |
70 (21) |
83 (28) |
89 (32) |
97 (36) |
104 (40) |
107 (42) |
103 (39) |
102 (39) |
88 (31) |
81 (27) |
67 (19) |
107 (42) |
| Mean daily maximum °F (°C) | 40.4 (4.7) |
46.9 (8.3) |
58.4 (14.7) |
65.7 (18.7) |
74.6 (23.7) |
85.3 (29.6) |
91.4 (33.0) |
88.6 (31.4) |
81.1 (27.3) |
68.1 (20.1) |
53.0 (11.7) |
41.0 (5.0) |
66.2 (19.0) |
| Mean daily minimum °F (°C) | 9.7 (−12.4) |
16.1 (−8.8) |
24.7 (−4.1) |
30.8 (−0.7) |
39.5 (4.2) |
47.0 (8.3) |
54.1 (12.3) |
52.2 (11.2) |
42.8 (6.0) |
31.7 (−0.2) |
20.0 (−6.7) |
11.2 (−11.6) |
31.7 (−0.2) |
| Record low °F (°C) | −34 (−37) |
−35 (−37) |
−7 (−22) |
5 (−15) |
13 (−11) |
25 (−4) |
29 (−2) |
30 (−1) |
19 (−7) |
0 (−18) |
−10 (−23) |
−28 (−33) |
−35 (−37) |
| Average precipitation inches (mm) | 0.63 (16) |
0.64 (16) |
0.59 (15) |
0.54 (14) |
0.72 (18) |
0.45 (11) |
0.59 (15) |
0.92 (23) |
1.03 (26) |
0.97 (25) |
0.46 (12) |
0.47 (12) |
8.01 (203) |
| Average snowfall inches (cm) | 5.5 (14) |
3.3 (8.4) |
1.4 (3.6) |
0.2 (0.51) |
trace | 0 (0) |
0 (0) |
0 (0) |
0 (0) |
0.1 (0.25) |
1.2 (3.0) |
4.9 (12) |
16.6 (41.76) |
| Average precipitation days (≥ 0.01 in) | 4.8 | 4.7 | 3.8 | 4.4 | 5.0 | 3.3 | 5.2 | 7.3 | 5.6 | 5.0 | 3.3 | 4.6 | 57.0 |
| Average snowy days (≥ 0.1 in) | 2.4 | 2.0 | 0.6 | 0.2 | 0.0 | 0 | 0 | 0 | 0 | 0.1 | 0.6 | 2.2 | 8.1 |
| Source 1: NCEI | |||||||||||||
| Source 2: xmacis | |||||||||||||
Education
Emery County School District operates public schools in the county.
See also
 In Spanish: Castle Dale (Utah) para niños


