Bertschikon bei Attikon facts for kids
Quick facts for kids
Bertschikon bei Attikon
|
||
|---|---|---|
 |
||
|
||
| Country | Switzerland | |
| Canton | Zurich | |
| District | Winterthur | |
| Area | ||
| • Total | 9.71 km2 (3.75 sq mi) | |
| Elevation | 506 m (1,660 ft) | |
| Population
(Dec 2020 )
|
||
| • Total | 1,084 | |
| • Density | 111.64/km2 (289.14/sq mi) | |
| Postal code |
8544
|
|
| Surrounded by | Elgg, Ellikon an der Thur, Elsau, Frauenfeld (TG), Gachnang (TG), Hagenbuch, Wiesendangen | |
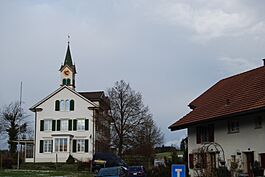
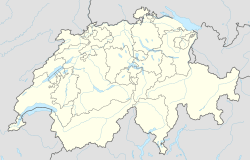
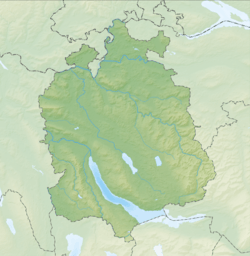
Bertschikon bei Attikon (or Bertschikon) is a former municipality in the district of Winterthur in the canton of Zürich in Switzerland. On 1 January 2014 the former municipality of Bertschikon merged into the municipality of Wiesendangen.
Contents
History
Bertschikon is first mentioned in 1255 as Bersinkon. The village of Gündlikon is first mentioned in 774 as Cundilinchova though the identification is debated. It is mentioned in 1162 as Gundilinchova. The municipality was created during the Helvetic Republic (1798–1803) though it wasn't fully established until 1882. It consists of seven old municipalities; Bertschikon, Gundetswil, Kefikon (Canton of Zürich portion only), Liebensberg, Stegen, Gündlikon and Zünikon.
Geography
Before the merger, Bertschikon had a total area of 9.6 km2 (3.7 sq mi). Of this area, 68.8% is used for agricultural purposes, while 20.2% is forested. Of the rest of the land, 10.8% is settled (buildings or roads) and the remainder (0.1%) is non-productive (rivers, glaciers or mountains). In 1996[update] housing and buildings made up 4.3% of the total area, while transportation infrastructure made up the rest (6.8%). Of the total unproductive area, water (streams and lakes) made up 0.1% of the area. As of 2007[update] 3.9% of the total municipal area was undergoing some type of construction.
The municipality consists of over 30 villages, hamlets and individual houses along the border with the Canton of Thurgau.
Demographics
Bertschikon had a population (as of 2011) of 1,049. As of 2007[update], 5.5% of the population was made up of foreign nationals. As of 2008[update] the gender distribution of the population was 51.3% male and 48.7% female. Over the last 10 years the population has grown at a rate of 2.6%. Most of the population (as of 2000[update]) speaks German (96.2%), with Italian being second most common ( 1.0%) and French being third ( 0.7%).
In the 2007 election the most popular party was the SVP which received 65.8% of the vote. The next three most popular parties were the CSP (10.2%), the SPS (7.4%) and the Green Party (6.1%).
The age distribution of the population (as of 2000[update]) is children and teenagers (0–19 years old) make up 27.1% of the population, while adults (20–64 years old) make up 61.2% and seniors (over 64 years old) make up 11.7%. The entire Swiss population is generally well educated. In Bertschikon about 81% of the population (between age 25-64) have completed either non-mandatory upper secondary education or additional higher education (either university or a Fachhochschule). There are 340 households in Bertschikon.
Bertschikon has an unemployment rate of 0.81%. As of 2005[update], there were 109 people employed in the primary economic sector and about 44 businesses involved in this sector. 38 people are employed in the secondary sector and there are 14 businesses in this sector. 99 people are employed in the tertiary sector, with 23 businesses in this sector. As of 2007[update] 35.6% of the working population were employed full-time, and 64.4% were employed part-time.
As of 2008[update] there were 184 Catholics and 684 Protestants in Bertschikon. In the 2000 census, religion was broken down into several smaller categories. From the census[update], 71.8% were some type of Protestant, with 67.9% belonging to the Swiss Reformed Church and 3.9% belonging to other Protestant churches. 17.5% of the population were Catholic. Of the rest of the population, 0% were Muslim, 1.4% belonged to another religion (not listed), 3.5% did not give a religion, and 5.6% were atheist or agnostic.
The historical population is given in the following table:
| year | population |
|---|---|
| 1836 | 823 |
| 1850 | 949 |
| 1900 | 643 |
| 1950 | 720 |
| 1960 | 733 |
| 2000 | 985 |
See also
 In Spanish: Bertschikon para niños


