Arvidsjaur Municipality facts for kids
Quick facts for kids
Arvidsjaur Municipality
Arvidsjaurs kommun
|
||
|---|---|---|

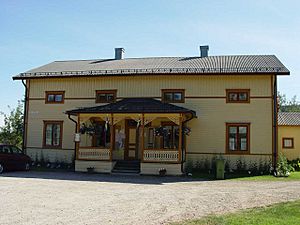
Arvidsjuar Museum
|
||
|
||
 |
||
| Country | Sweden | |
| County | Norrbotten County | |
| Seat | Arvidsjaur | |
| Area | ||
| • Total | 6,169.66 km2 (2,382.12 sq mi) | |
| • Land | 5,699.06 km2 (2,200.42 sq mi) | |
| • Water | 470.6 km2 (181.7 sq mi) | |
| Area as of January 1, 2010. | ||
| Population
(June 30, 2012)
|
||
| • Total | 6,599 | |
| • Density | 1.06959/km2 (2.77022/sq mi) | |
| Time zone | UTC+1 (CET) | |
| • Summer (DST) | UTC+2 (CEST) | |
| ISO 3166 code | SE | |
| Province | Lapland | |
| Municipal code | 2505 | |
| Website | www.arvidsjaur.se | |
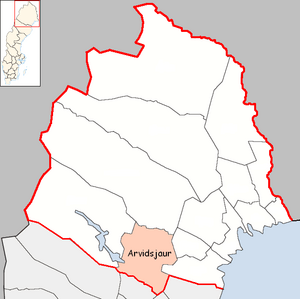
Arvidsjaur Municipality (Swedish: Arvidsjaurs kommun; Ume Sami: Árviesjávrrien kommuvdna) is a municipality in Norrbotten County in northern Sweden. Its seat is Arvidsjaur.
Contents
History
Arvidsjaur Municipality was for a long time inhabited only by the Sami people. They were back then a hunting people, living off the abundance of fish and wildlife in the area. Archaeological discoveries suggest that people have been moving through the area for several thousands of years. The name Arvidsjaur itself comes from a Sami word which means "generous water" and was originally the name of the adjacent lake.
In the 14th and 15th century some farmers settled in the area. They acquired furs and skins from the hunters, and traded them off to southern regions, allegedly in vast numbers.
The Christianization of Arvidsjaur Municipality was slow, as it was in Norrland as a whole, because of the low population, the harsh climate and the long distances. It was also commonly believed that Norrland was inhabited by magicians.
Not until 1577 did the first settler, Per Käck, settle in Arvidsjaur. The settlers built the first chapel at the marketplace at the time, in 1560. The first church was inaugurated in 1604.
The Swedish minister and missionary Petrus Læstadius (1802–1841; brother of Lars Levi Læstadius, founder of the largest Christian revival movement in Norrland) collected old stories and myths in the area in the 19th century, which create the basis for our knowledge from that time.
Geography
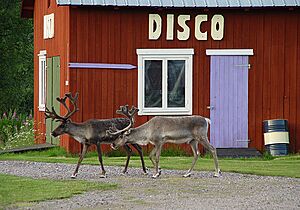
Arvidsjaur Municipality is located about 110 kilometres south of the Arctic Circle, in the center of the northernmost land, Norrland. It is also part of the geographic area Lapland, which consists of the northern parts of Sweden, Norway and Finland. Sami people are an indigenous minority group who mainly live on breeding reindeer. Arvidsjaur Municipality still contains several Sami villages, and as a tribute to the Sami people a reindeer is the basis for the municipal coat of arms.
Localities
There are three localities (or urban areas) in Arvidsjaur Municipality:
| # | Locality | Population |
|---|---|---|
| 1 | Arvidsjaur | 4,644 |
| 2 | Glommersträsk | 306 |
| 3 | Moskosel | 299 |
The municipal seat in bold
Demographics
This is a demographic table based on Arvidsjaur Municipality's electoral districts in the 2022 Swedish general election sourced from SVT's election platform, in turn taken from SCB official statistics.
Residents include everyone registered as living in the district, regardless of age or citizenship status. Valid voters indicate Swedish citizens above the age of 18 who therefore can vote in general elections. Left vote and right vote indicate the result between the two major blocs in said district in the 2022 general election. Employment indicates the share of people between the ages of 20 and 64 who are working taxpayers. Foreign background is defined as residents either born abroad or with two parents born outside of Sweden. Median income is the received monthly income through either employment, capital gains or social grants for the median adult above 20, also including pensioners in Swedish kronor. The section about college graduates indicates any degree accumulated after high school.
In total there were 6,139 residents, including 4,772 Swedish citizens of voting age. 56.0 % voted for the left coalition and 43.1 % for the right coalition.
| Location | Residents | Valid voters | Left vote | Right vote | Employed | SV parents | 1st/2nd gen | Income | College |
|---|---|---|---|---|---|---|---|---|---|
| % | % | % | % | % | % | ||||
| Arvidsjaur N | 2,221 | 1,674 | 51.0 | 47.7 | 81 | 87 | 13 | 24,629 | 29 |
| Arvidsjaur V | 1,957 | 1,593 | 63.8 | 35.5 | 80 | 89 | 11 | 22,811 | 26 |
| Arvidsjaur Ö | 1,961 | 1,505 | 55.0 | 44.3 | 86 | 92 | 8 | 26,142 | 25 |
| Source: SVT | |||||||||
Elections
Riksdag
These are the results of the elections to the Riksdag since the 1972 municipal reform. Norrbotten Party also contested the 1994 election but due to the party's small size at a nationwide level SCB did not publish the party's results at a municipal level. The same applies to the Sweden Democrats between 1988 and 1998. "Turnout" denotes the percentage of eligible voters casting any ballots, whereas "Votes" denotes the number of actual valid ballots cast.
| Year | Turnout | Votes | V | S | MP | C | L | KD | M | SD | ND | NP/SP |
|---|---|---|---|---|---|---|---|---|---|---|---|---|
| 1973 | 90.3 | 5,512 | 15.8 | 51.4 | 0.0 | 18.5 | 5.9 | 2.1 | 5.4 | 0.0 | 0.0 | 0.0 |
| 1976 | 90.3 | 5,604 | 13.5 | 53.7 | 0.0 | 19.1 | 6.2 | 2.5 | 4.3 | 0.0 | 0.0 | 0.0 |
| 1979 | 90.5 | 5,704 | 11.5 | 56.3 | 0.0 | 15.6 | 6.4 | 2.7 | 5.6 | 0.0 | 0.0 | 0.0 |
| 1982 | 90.6 | 5,872 | 11.0 | 58.9 | 0.5 | 13.0 | 3.8 | 2.7 | 8.2 | 0.0 | 0.0 | 0.0 |
| 1985 | 90.1 | 5,836 | 10.8 | 60.1 | 0.5 | 11.9 | 8.4 | 0.0 | 8.0 | 0.0 | 0.0 | 0.0 |
| 1988 | 85.9 | 5,458 | 11.6 | 59.3 | 3.1 | 8.7 | 7.5 | 3.0 | 6.0 | 0.0 | 0.0 | 0.0 |
| 1991 | 85.0 | 5,331 | 9.7 | 55.9 | 1.1 | 9.3 | 6.3 | 5.1 | 9.0 | 0.0 | 3.0 | 0.0 |
| 1994 | 87.0 | 5,390 | 12.1 | 62.0 | 2.8 | 6.5 | 3.9 | 2.7 | 8.8 | 0.0 | 0.3 | 0.0 |
| 1998 | 82.0 | 4,807 | 24.6 | 49.2 | 2.7 | 5.4 | 3.2 | 5.5 | 8.4 | 0.0 | 0.0 | 0.0 |
| 2002 | 79.1 | 4,425 | 14.5 | 53.8 | 1.8 | 7.4 | 5.4 | 4.3 | 5.0 | 0.0 | 0.0 | 6.5 |
| 2006 | 81.9 | 4,438 | 12.5 | 57.5 | 1.7 | 7.5 | 3.9 | 2.1 | 10.5 | 1.0 | 0.0 | 1.6 |
| 2010 | 84.1 | 4,411 | 11.1 | 54.0 | 2.6 | 7.2 | 4.1 | 2.0 | 13.4 | 4.5 | 0.0 | 0.0 |
| 2014 | 85.0 | 4,326 | 10.2 | 52.1 | 1.6 | 6.2 | 3.1 | 1.8 | 10.1 | 13.1 | 0.0 | 0.0 |
Blocs
This lists the relative strength of the socialist and centre-right blocs since 1973, but parties not elected to the Riksdag are inserted as "other", including the Sweden Democrats results from 1988 to 2006, but also the Christian Democrats pre-1991 and the Greens in 1982, 1985 and 1991. The sources are identical to the table above. The coalition or government mandate marked in bold formed the government after the election. New Democracy got elected in 1991 but are still listed as "other" due to the short lifespan of the party.
| Year | Turnout | Votes | Left | Right | SD | Other | Elected |
|---|---|---|---|---|---|---|---|
| 1973 | 90.3 | 5,512 | 67.2 | 29.8 | 0.0 | 3.0 | 97.0 |
| 1976 | 90.3 | 5,604 | 67.2 | 29.6 | 0.0 | 3.2 | 96.8 |
| 1979 | 90.5 | 5,704 | 67.8 | 27.6 | 0.0 | 4.6 | 95.4 |
| 1982 | 90.6 | 5,872 | 69.9 | 25.0 | 0.0 | 5.1 | 94.9 |
| 1985 | 90.1 | 5,836 | 70.9 | 28.3 | 0.0 | 0.9 | 99.1 |
| 1988 | 85.9 | 5,458 | 74.0 | 22.2 | 0.0 | 3.8 | 96.2 |
| 1991 | 85.0 | 5,331 | 65.6 | 29.7 | 0.0 | 4.7 | 98.1 |
| 1994 | 87.0 | 5,390 | 76.9 | 21.9 | 0.0 | 1.2 | 98.8 |
| 1998 | 82.0 | 4,807 | 76.5 | 22.5 | 0.0 | 1.0 | 99.0 |
| 2002 | 79.1 | 4,425 | 70.1 | 22.1 | 0.0 | 7.8 | 92.2 |
| 2006 | 81.9 | 4,438 | 71.7 | 24.0 | 0.0 | 4.3 | 95.7 |
| 2010 | 84.1 | 4,411 | 67.7 | 26.7 | 4.5 | 1.1 | 98.9 |
| 2014 | 85.0 | 4,326 | 63.9 | 21.2 | 13.1 | 1.8 | 98.2 |


