Amber Valley (UK Parliament constituency) facts for kids
Quick facts for kids {{{Name}}}[[{{{Type}}} constituency]] |
|
|---|---|
| [[Image:{{{Map1}}}Constituency.svg|120px|]] [[Image:England{{{Map2}}}.svg|120px|]] |
|
| {{{Name}}} shown within [[{{{Entity}}}]], and {{{Entity}}} shown within England | |
| Created: | {{{Year}}} |
| MP: | {{{MP}}} |
| Party: | {{{Party}}} |
| Type: | House of Commons |
| County: | [[{{{County}}}]] |
| EP constituency: | [[{{{EP}}} (European Parliament constituency)|{{{EP}}}]] |
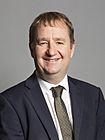
Amber Valley is a constituency of the Parliament of the United Kingdom in Derbyshire, England. Conservative politician Nigel Mills has represented the constituency in the House of Commons since 2010. It was first created in 1983 from three older constituencies.
Contents
Members of Parliament
| Parliament | Years | Member | Party | ||
|---|---|---|---|---|---|
| Constituency created from Belper, South East Derbyshire and Ilkeston | |||||
| 49th | 1983–1987 | Phillip Oppenheim | Conservative | ||
| 50th | 1987–1992 | ||||
| 51st | 1992–1997 | ||||
| 52nd | 1997–2001 | Judy Mallaber | Labour | ||
| 53rd | 2001–2005 | ||||
| 54th | 2005–2010 | ||||
| 55th | 2010–2015 | Nigel Mills |  |
Conservative | |
| 56th | 2015–2017 | ||||
| 57th | 2017–2019 | ||||
| 58th | 2019–present | ||||
Elections
Elections in the 2010s
| General election 2019: Amber Valley | |||||
|---|---|---|---|---|---|
| Party | Candidate | Votes | % | ±% | |
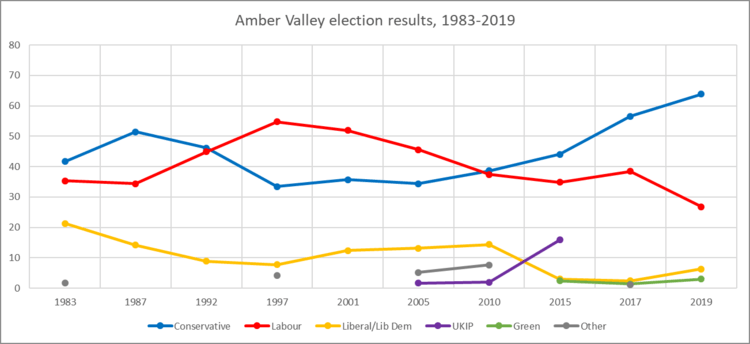
| Conservative | Nigel Mills | 29,096 | 63.8 | +7.3 | |
| Labour | Adam Thompson | 12,210 | 26.8 | −11.6 | |
| Liberal Democrats | Kate Smith | 2,873 | 6.3 | +3.9 | |
| Green | Lian Pizzey | 1,388 | 3.0 | +1.6 | |
| Majority | 16,886 | 37.0 | +18.9 | ||
| Turnout | 45,556 | 65.1 | −2.3 | ||
| Conservative hold | Swing | +9.5 | |||
| General election 2017: Amber Valley | |||||
|---|---|---|---|---|---|
| Party | Candidate | Votes | % | ±% | |
| Conservative | Nigel Mills | 25,905 | 56.5 | +12.6 | |
| Labour | James Dawson | 17,605 | 38.4 | +3.6 | |
| Liberal Democrats | Kate Smith | 1,100 | 2.4 | −0.6 | |
| Green | Matt McGuinness | 650 | 1.4 | −1.0 | |
| Independent | Daniel Bamford | 551 | 1.2 | N/A | |
| Majority | 8,300 | 18.1 | +8.9 | ||
| Turnout | 45,811 | 67.4 | +2.3 | ||
| Conservative hold | Swing | +4.5 | |||
| General election 2015: Amber Valley | |||||
|---|---|---|---|---|---|
| Party | Candidate | Votes | % | ±% | |
| Conservative | Nigel Mills | 20,106 | 44.0 | +5.4 | |
| Labour | Kevin Gillott | 15,901 | 34.8 | −2.7 | |
| UKIP | Stuart Bent | 7,263 | 15.9 | +13.9 | |
| Liberal Democrats | Kate Smith | 1,360 | 3.0 | −11.5 | |
| Green | John Devine | 1,087 | 2.4 | +2.4 | |
| Majority | 4,205 | 9.2 | +8.0 | ||
| Turnout | 45,717 | 65.1 | -0.4 | ||
| Conservative hold | Swing | +4.0 | |||
| General election 2010: Amber Valley | |||||
|---|---|---|---|---|---|
| Party | Candidate | Votes | % | ±% | |
| Conservative | Nigel Mills | 17,746 | 38.6 | +4.7 | |
| Labour | Judy Mallaber | 17,210 | 37.4 | −9.0 | |
| Liberal Democrats | Tom Snowdon | 6,636 | 14.4 | +2.1 | |
| BNP | Michael Clarke | 3,195 | 7.0 | +4.4 | |
| UKIP | Sue Ransome | 906 | 2.0 | +0.3 | |
| Monster Raving Loony | Sam Thing | 265 | 0.6 | N/A | |
| Majority | 536 | 1.2 | N/A | ||
| Turnout | 45,958 | 65.5 | +1.5 | ||
| Conservative gain from Labour | Swing | +6.9 | |||
Elections in the 2000s
| General election 2005: Amber Valley | |||||
|---|---|---|---|---|---|
| Party | Candidate | Votes | % | ±% | |
| Labour | Judy Mallaber | 21,593 | 45.6 | −6.3 | |
| Conservative | Gillian Shaw | 16,318 | 34.4 | −1.3 | |
| Liberal Democrats | Kate Smith | 6,225 | 13.1 | +0.7 | |
| BNP | Paul Snell | 1,243 | 2.6 | N/A | |
| Veritas | Alex Stevenson | 1,224 | 2.6 | N/A | |
| UKIP | Hugh Price | 788 | 1.7 | N/A | |
| Majority | 5,275 | 11.1 | −5.1 | ||
| Turnout | 47,391 | 62.9 | +2.6 | ||
| Labour hold | Swing | −3.8 | |||
| General election 2001: Amber Valley | |||||
|---|---|---|---|---|---|
| Party | Candidate | Votes | % | ±% | |
| Labour | Judy Mallaber | 23,101 | 51.9 | −2.8 | |
| Conservative | Gillian Shaw | 15,874 | 35.7 | +2.2 | |
| Liberal Democrats | Kate Smith | 5,538 | 12.4 | +4.7 | |
| Majority | 7,227 | 16.2 | −5.1 | ||
| Turnout | 44,513 | 60.3 | −15.6 | ||
| Labour hold | Swing | −2.5 | |||
Elections in the 1990s
| General election 1997: Amber Valley | |||||
|---|---|---|---|---|---|
| Party | Candidate | Votes | % | ±% | |
| Labour | Judy Mallaber | 29,943 | 54.7 | +10.3 | |
| Conservative | Phillip Oppenheim | 18,330 | 33.4 | −13.0 | |
| Liberal Democrats | Roger Shelley | 4,219 | 7.7 | −1.4 | |
| Referendum | Irene McGibbon | 2,283 | 4.2 | N/A | |
| Majority | 11,613 | 21.3 | N/A | ||
| Turnout | 54,775 | 76.0 | −8.7 | ||
| Labour gain from Conservative | Swing | 11.7 | |||
| General election 1992: Amber Valley | |||||
|---|---|---|---|---|---|
| Party | Candidate | Votes | % | ±% | |
| Conservative | Phillip Oppenheim | 27,418 | 46.1 | −5.3 | |
| Labour | John Cooper | 26,706 | 44.9 | +10.6 | |
| Liberal Democrats | Graham Brocklebank | 5,294 | 8.9 | −5.3 | |
| Majority | 712 | 1.2 | −15.9 | ||
| Turnout | 59,418 | 84.7 | +3.5 | ||
| Conservative hold | Swing | −7.9 | |||
Elections in the 1980s
| General election 1987: Amber Valley | |||||
|---|---|---|---|---|---|
| Party | Candidate | Votes | % | ±% | |
| Conservative | Phillip Oppenheim | 28,603 | 51.4 | +9.7 | |
| Labour | David Bookbinder | 19,103 | 34.4 | −0.9 | |
| Liberal | Stewart Reynolds | 7,904 | 14.2 | −7.1 | |
| Majority | 9,500 | 17.1 | +10.7 | ||
| Turnout | 68,478 | 81.2 | +4.0 | ||
| Conservative hold | Swing | +5.3 | |||
| General election 1983: Amber Valley | |||||
|---|---|---|---|---|---|
| Party | Candidate | Votes | % | ±% | |
| Conservative | Phillip Oppenheim | 21,502 | 41.7 | N/A | |
| Labour | David Bookbinder | 18,184 | 35.3 | N/A | |
| Liberal | Brian Johnson | 10,989 | 21.3 | N/A | |
| Independent | Peter Griffiths | 856 | 1.7 | N/A | |
| Majority | 3,318 | 6.4 | N/A | ||
| Turnout | 66,720 | 77.2 | N/A | ||
| Conservative win (new seat) | |||||

All content from Kiddle encyclopedia articles (including the article images and facts) can be freely used under Attribution-ShareAlike license, unless stated otherwise. Cite this article:
Amber Valley (UK Parliament constituency) Facts for Kids. Kiddle Encyclopedia.

