Alturas, California facts for kids
Quick facts for kids
Alturas, California
|
||
|---|---|---|
|
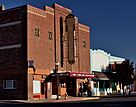
Top: Nevada-California-Oregon Railway Building (left), Modoc County Courthouse (right); bottom: Sacred Heart Church (left), Niles Theater (right)
|
||
|
||
| Motto(s):
"Where the West Still Lives"
|
||
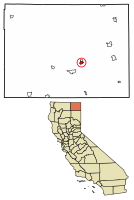
Location of Alturas in Modoc County, California
|
||
| Country | United States | |
| State | California | |
| County | Modoc | |
| Incorporated | September 16, 1901 | |
| Area | ||
| • Total | 2.85 sq mi (7.39 km2) | |
| • Land | 2.84 sq mi (7.35 km2) | |
| • Water | 0.02 sq mi (0.05 km2) 0.57% | |
| Elevation | 4,370 ft (1,332 m) | |
| Population
(2020)
|
||
| • Total | 2,715 | |
| • Density | 957.33/sq mi (369.61/km2) | |
| Time zone | UTC-8 (Pacific Time Zone) | |
| • Summer (DST) | UTC-7 (PDT) | |
| ZIP code |
96101
|
|
| Area code | 530 | |
| FIPS code | 06-01444 | |
| GNIS feature IDs | 277469, 2409688 | |
Alturas (Spanish for "Heights"; Achumawi: Kasalektawi) is a city and the county seat of Modoc County, California. Located in the Shasta Cascade region of Northern California, the city had a population of 2,715 at the 2020 census. Alturas is located at the confluence of the south and north forks of the Pit River, east of the center of Modoc County, at an elevation of 4,370 feet (1,330 m). Alturas is one of the largest cities in the region and a local economic hub.
Contents
History

Alturas occupies what was initially an Achumawi (Pit River) village known as Kosealekte or Kasalektawi. The city was initially known as Dorris Bridge or Dorris' Bridge, named after Pressley and James Dorris, who built a bridge across the Pit River at this location.
The Dorris Bridge post office opened in 1871. The town was renamed Dorrisville in 1874 and Alturas in 1876, the latter meaning "heights" in Spanish. The census of 1880 showed a population of 148. However, settlement continued over the next two decades, until the city was incorporated on September 16, 1901. Because of its central location, Dorrisville became the county seat when Modoc County formed in 1874, even though both Adin and Cedarville were then larger towns.
Geography
Alturas straddles the North Fork of the Pit River, near its confluence with the South Fork in the north end of South Fork Valley, in the extreme northeastern corner of California at 41°29′14″N 120°32′33″W / 41.48722°N 120.54250°W. The tall Warner Mountains lie to the east, the wetlands and wild rice fields of South Fork Valley to the south, and the extensive Modoc Plateau to the north.
According to the United States Census Bureau, the city has a total area of 2.4 square miles (6.2 km2) and 0.57% of it is covered by water.
Climate
The climate in Alturas is cold semi-arid (Köppen: BSk), bordering humid continental (Dsb). The average January temperatures are a high of 43.0 °F (6.1 °C) and a low of 20.6 °F (−6.3 °C). The average July temperatures are a high of 89.1 °F (31.7 °C) and a low of 47.2 °F (8.4 °C). There are an average of 39.8 days with highs of 90 °F (32.2 °C) or higher and an average of 195.5 days with lows of 32 °F (0 °C) or lower. The record high was 107 °F (41.7 °C) on July 19, 1960, and July 10–11, 2002, and the record low was −34 °F (−36.7 °C) on December 9, 1972. Freezing temperatures have occurred in every month of the year; cool nights are common even on the hottest summer days.
Precipitation averages 11.68 inches (297 mm) annually. There are an average of 90.8 days with measurable precipitation. The wettest year was 1952 with 20.80 in (528 mm) and the driest year was 2013 with 6.29 in (160 mm). The most precipitation in one month was 6.17 in (156.7 mm) in October 1962, and the most in 24 hours was 3.51 in (89.2 mm) on December 11, 1937. Snowfall averages 30.9 in (78 cm) per season. The most snowfall in a season was 85.5 in (217 cm) in 1952.
| Climate data for Alturas, California (Alturas Municipal Airport), 1991–2020 normals, extremes 1935–present | |||||||||||||
|---|---|---|---|---|---|---|---|---|---|---|---|---|---|
| Month | Jan | Feb | Mar | Apr | May | Jun | Jul | Aug | Sep | Oct | Nov | Dec | Year |
| Record high °F (°C) | 69 (21) |
72 (22) |
82 (28) |
85 (29) |
95 (35) |
105 (41) |
107 (42) |
106 (41) |
106 (41) |
93 (34) |
82 (28) |
71 (22) |
107 (42) |
| Mean maximum °F (°C) | 56.6 (13.7) |
60.4 (15.8) |
69.4 (20.8) |
76.5 (24.7) |
85.3 (29.6) |
93.2 (34.0) |
99.1 (37.3) |
98.0 (36.7) |
92.8 (33.8) |
82.1 (27.8) |
69.5 (20.8) |
55.2 (12.9) |
100.3 (37.9) |
| Mean daily maximum °F (°C) | 43.0 (6.1) |
46.6 (8.1) |
52.7 (11.5) |
58.4 (14.7) |
67.9 (19.9) |
78.2 (25.7) |
89.1 (31.7) |
87.3 (30.7) |
79.7 (26.5) |
65.7 (18.7) |
50.8 (10.4) |
41.0 (5.0) |
63.4 (17.4) |
| Daily mean °F (°C) | 31.8 (−0.1) |
34.8 (1.6) |
39.6 (4.2) |
44.3 (6.8) |
52.5 (11.4) |
60.2 (15.7) |
68.2 (20.1) |
65.8 (18.8) |
58.5 (14.7) |
47.5 (8.6) |
37.7 (3.2) |
30.5 (−0.8) |
47.6 (8.7) |
| Mean daily minimum °F (°C) | 20.6 (−6.3) |
23.0 (−5.0) |
26.5 (−3.1) |
30.1 (−1.1) |
37.2 (2.9) |
42.2 (5.7) |
47.2 (8.4) |
44.2 (6.8) |
37.2 (2.9) |
29.3 (−1.5) |
24.5 (−4.2) |
20.0 (−6.7) |
31.8 (−0.1) |
| Mean minimum °F (°C) | −0.5 (−18.1) |
6.2 (−14.3) |
11.1 (−11.6) |
17.5 (−8.1) |
23.9 (−4.5) |
30.3 (−0.9) |
36.4 (2.4) |
34.4 (1.3) |
26.0 (−3.3) |
15.5 (−9.2) |
5.9 (−14.5) |
−0.6 (−18.1) |
−7.1 (−21.7) |
| Record low °F (°C) | −32 (−36) |
−33 (−36) |
−7 (−22) |
7 (−14) |
14 (−10) |
21 (−6) |
28 (−2) |
26 (−3) |
15 (−9) |
0 (−18) |
−17 (−27) |
−34 (−37) |
−34 (−37) |
| Average precipitation inches (mm) | 1.31 (33) |
1.09 (28) |
1.38 (35) |
1.47 (37) |
1.26 (32) |
0.70 (18) |
0.29 (7.4) |
0.27 (6.9) |
0.35 (8.9) |
0.89 (23) |
1.20 (30) |
1.47 (37) |
11.68 (296.2) |
| Average snowfall inches (cm) | 8.4 (21) |
6.2 (16) |
5.4 (14) |
2.9 (7.4) |
0.9 (2.3) |
0.0 (0.0) |
0.0 (0.0) |
0.0 (0.0) |
0.0 (0.0) |
0.3 (0.76) |
3.5 (8.9) |
6.6 (17) |
34.2 (87.36) |
| Average extreme snow depth inches (cm) | 4.4 (11) |
3.0 (7.6) |
2.6 (6.6) |
1.1 (2.8) |
0.4 (1.0) |
0.0 (0.0) |
0.0 (0.0) |
0.0 (0.0) |
0.0 (0.0) |
0.2 (0.51) |
1.6 (4.1) |
2.6 (6.6) |
5.6 (14) |
| Average precipitation days (≥ 0.01 in) | 11.0 | 10.7 | 11.3 | 10.7 | 8.6 | 4.6 | 2.0 | 2.1 | 2.9 | 5.2 | 9.6 | 12.1 | 90.8 |
| Average snowy days (≥ 0.1 in) | 4.0 | 3.3 | 2.6 | 1.4 | 0.4 | 0.0 | 0.0 | 0.0 | 0.0 | 0.3 | 1.8 | 3.3 | 17.1 |
| Source 1: NOAA | |||||||||||||
| Source 2: National Weather Service (snow/snow days 1935–2018) | |||||||||||||
Demographics
| Historical population | |||
|---|---|---|---|
| Census | Pop. | %± | |
| 1880 | 148 | — | |
| 1910 | 916 | — | |
| 1920 | 979 | 6.9% | |
| 1930 | 2,338 | 138.8% | |
| 1940 | 2,090 | −10.6% | |
| 1950 | 2,819 | 34.9% | |
| 1960 | 2,819 | 0.0% | |
| 1970 | 2,799 | −0.7% | |
| 1980 | 3,025 | 8.1% | |
| 1990 | 3,231 | 6.8% | |
| 2000 | 2,892 | −10.5% | |
| 2010 | 2,827 | −2.2% | |
| 2020 | 2,715 | −4.0% | |
| U.S. Decennial Census | |||
2000
At the 2000 census there were 2,892 people in 1,181 households, including 753 families, in the city. The population density was 1,316.3 inhabitants per square mile (508.2/km2). There were 1,367 housing units at an average density of 622.2 per square mile (240.2/km2). The racial makeup of the city was 85.9% White, 0.3% Black or African American, 4.4% Native American, 0.7% Asian, 0.1% Pacific Islander, 4.8% from other races, and 3.7% from two or more races. 11.9% of the population were Hispanic or Latino of any race. Of the 1,181 households 35.3% had children under the age of 18 living with them, 45.6% were married couples living together, 14.1% had a female householder with no husband present, and 36.2% were non-families. 32.5% of households were one person and 14.5% were one person aged 65 or older. The average household size was 2.38 and the average family size was 3.00.
The age distribution was 28.7% under the age of 18, 6.6% from 18 to 24, 24.9% from 25 to 44, 22.9% from 45 to 64, and 16.9% 65 or older. The median age was 38 years. For every 100 females, there were 90.5 males. For every 100 females age 18 and over, there were 85.3 males.
The median household income was $24,351 and the median family income was $31,385. Males had a median income of $36,500 versus $21,750 for females. The per capita income for the city was $19,281. About 23.0% of families and 27.1% of the population were below the poverty line, including 38.3% of those under age 18 and 7.9% of those age 65 or over.
2010
At the 2010 census Alturas had a population of 2,827. The population density was 1,154.5 inhabitants per square mile (445.8/km2). The racial makeup of Alturas was 2,430 (86.0%) White, 15 (0.5%) African American, 81 (2.9%) Native American, 45 (1.6%) Asian, 7 (0.2%) Pacific Islander, 118 (4.2%) from other races, and 131 (4.6%) from two or more races. Hispanic or Latino of any race were 347 people (12.3%).
The census reported that 2,814 people (99.5% of the population) lived in households, none lived in non-institutionalized group quarters, and 13 (0.5%) were institutionalized.
There were 1,238 households, 391 (31.6%) had children under the age of 18 living in them, 507 (41.0%) were opposite-sex married couples living together, 181 (14.6%) had a female householder with no husband present, 65 (5.3%) had a male householder with no wife present. There were 102 (8.2%) unmarried opposite-sex partnerships, and 9 (0.7%) same-sex married couples or partnerships. 403 households (32.6%) were one person and 160 (12.9%) had someone living alone who was 65 or older. The average household size was 2.27. There were 753 families (60.8% of households); the average family size was 2.85.
The age distribution was 702 people (24.8%) under the age of 18, 219 people (7.7%) aged 18 to 24, 672 people (23.8%) aged 25 to 44, 802 people (28.4%) aged 45 to 64, and 432 people (15.3%) who were 65 or older. The median age was 39.9 years. For every 100 females, there were 92.7 males. For every 100 females age 18 and over, there were 88.6 males.
There were 1,407 housing units at an average density of 574.6 per square mile, of the occupied units 691 (55.8%) were owner-occupied and 547 (44.2%) were rented. The homeowner vacancy rate was 2.8%; the rental vacancy rate was 7.8%. 1,563 people (55.3% of the population) lived in owner-occupied housing units and 1,251 people (44.3%) lived in rental housing units.
Economy
Alturas is the headquarters to the Modoc National Forest, the Applegate Field Office of the Bureau of Land Management, the Modoc National Wildlife Refuge and other recreation areas, and is the trade center for the agricultural region, which produces beef, sheep, potatoes, alfalfa and lumber. Despite its abundance of wilderness, recreational opportunities, hunting and fishing resources, and natural environment, tourism is not a major sector of the local economy – largely due to the city's remote location.
Local, State, Federal, and Tribal governments are the largest employers in Alturas. A vibrant timber industry collapsed in the early 1980s due to increased production costs and low market prices for softwood lumber.
The Modoc Joint Unified School District is headquartered in Alturas.
The Alturas Rancheria, a band of Pit River Indians, operates a small casino just outside the city limits.
Transportation

Alturas is served by U.S. Route 395 and California State Route 299. U.S. 395 comes in from the south from Susanville and Reno. State Route 299 comes in from the west from Redding. Both highways merge in Alturas and head out of the city as a concurrency northeast toward Lakeview, Oregon; and Cedarville, respectively.
The Modoc Subdivision track of the Union Pacific Railroad and the Lake County Railroad (of Lake County, Oregon) serve the area. Alturas Municipal Airport is a public-use, general aviation facility located one nautical mile (1.2 mi; 1.9 km) west of the city's central business district.
Notable people
- Kayte Christensen, WNBA basketball player
- Ernest S. Brown, former United States Senator from Nevada
- John E. Raker (1863–1926), Congressman from California (served 1911–1926) and author of the Raker Act
- Robert "Top Gun" Hight, NHRA drag racer John Force Racing
See also
 In Spanish: Alturas (California) para niños


