2001 United Kingdom census facts for kids
Quick facts for kids Census 2001 |
|
|---|---|
 |
|
| General information | |
| Country | United Kingdom of Great Britain and Northern Ireland |
| Date taken | 29 April 2001 |
A nationwide census, known as Census 2001, was conducted in the United Kingdom on Sunday, 29 April 2001. This was the 20th UK census and recorded a resident population of 58,789,194.
The 2001 UK census was organised by the Office for National Statistics (ONS) in England and Wales, the General Register Office for Scotland (GROS) and the Northern Ireland Statistics and Research Agency (NISRA). Detailed results by region, council area, ward and output area are available from their respective websites.
Contents
Organisation
Similar to previous UK censuses, the 2001 census was organised by the three statistical agencies, ONS, GROS, and NISRA, and coordinated at the national level by the Office for National Statistics. The Orders in Council to conduct the census, specifying the people and information to be included in the census, were made under the authority of the Census Act 1920 in Great Britain, and the Census Act (Northern Ireland) 1969 in Northern Ireland. In England and Wales these regulations were made by the Census Order 2000 (SI 744/2000), in Scotland by the Census (Scotland) Order 2000 (SSI 68/2000), and in Northern Ireland by the Census Order (Northern Ireland) 2000 (SRNI 168/2000).
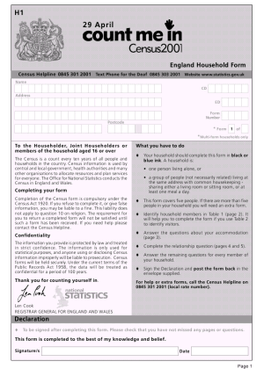
The census was administered through self-completion forms, in most cases delivered by enumerators to households and communal establishments in the three weeks before census night on 29 April. For the first time return by post was used as the main collection method, with enumerators following up in person where the forms were not returned. The postal response rate was 88% in England and Wales, 91% in Scotland, and 92% in Northern Ireland. A total of 81,000 field staff were employed across the UK (70,000 in England and Wales, 8,000 in Scotland and 3,000 in Northern Ireland). The census was conducted at the height of the foot-and-mouth crisis, which led to extra precautions being adopted by the field staff, and suggestions that the census may have to be postponed. However, it was reported that the disease outbreak did not affect the effectiveness of the collection process.
The census was estimated to cost £259m over its 13-year cycle from the start of planning in 1993 to the delivery of final results in 2006. Printing of the 30 million census forms was subcontracted to Polestar Group, and processing of the returned census forms was subcontracted to Lockheed Martin in a contract worth £54m. The forms were initially scanned into digital format, then read with OMR and OCR, with manual entry where the automatic process could not read the forms. The forms were then pulped and recycled, and the digital copies printed onto microfilm for storage and release after 100 years. Once the data were returned to the statistics agencies it underwent further processing to ensure consistency and to impute missing values.
Enumeration
The overall response rate for the census, that is the proportion of the population who were included on a census form, was estimated to be 94% in England and Wales, 96.1% in Scotland and 95.2% in Northern Ireland. This was due to a number of factors: households with no response, households excluding residents from their returns, and addresses not included in the enumeration. In Manchester for example 25,000 people from 14,000 addresses were not enumerated because the address database was two years out of date. The Local Authority with the lowest response was Kensington and Chelsea with 64%. Hackney had the next lowest response at 72%. Out of all local authorities, the ten lowest response rates were all in London. The results still represent 100 per cent of the population, however, because some individuals not completing their forms were instead identified by census enumerators, and through the use of cross-matching with a follow-up survey.
One Number Census
The results from the 2001 census were produced using a methodology known as the One Number Census. This was an attempt to adjust the census counts and impute answers to allow for estimated under-enumeration measured by the Census Coverage Survey (sample size 320,000 households), resulting in a single set of population estimates.
Religion
Although the 1851 census had included a question about religion on a separate response sheet, whose completion was not compulsory, the 2001 census was the first in Great Britain to ask about the religion of respondents on the main census form. An amendment to the 1920 Census Act (the Census (Amendment) Act 2000) was passed by Parliament to allow the question to be asked, and to allow the response to this question to be optional. The inclusion of the question enabled the Jedi census phenomenon to take place in the United Kingdom. In England and Wales 390,127 people stated their religion as Jedi, as did 14,052 people in Scotland. The percentages of religious affiliations were:
- Christian: 72.0%
- Muslim: 3%
- Hindu: 1%
- Sikh: 0.6%
- Jewish: 0.5%
- Buddhist: 0.3%
- Any other religion: 0.3%
15% declared themselves of no religion (including Jedi at 0.7%, more than those who declared themselves as Sikh, Jewish or Buddhist) and 8% did not respond to the question.
Ethnicity
Results
The census ethnic groups included White (White British, White Irish, Other White), Mixed (White and Black Caribbean, White and Black African, White and Asian, Other Mixed), Asian or Asian British (Indian, Pakistani, Bangladeshi, Other Asian), Black or Black British (Black Caribbean, African, Other Black) and Chinese or Other Ethnic Group.
| Ethnic group | Population | % of total* |
|---|---|---|
| White British | 50,366,497 | 85.67% |
| White (other) | 3,096,169 | 5.27% |
| Indian | 1,053,411 | 1.8% |
| Pakistani | 747,285 | 1.3% |
| White Irish | 691,232 | 1.2% |
| Mixed race | 677,117 | 1.2% |
| Black Caribbean | 565,876 | 1.0% |
| Black African | 485,277 | 0.8% |
| Bangladeshi | 283,063 | 0.5% |
| Other Asian (non-Chinese) | 247,664 | 0.4% |
| Chinese | 247,403 | 0.4% |
| Other | 230,615 | 0.4% |
| Black (others) | 97,585 | 0.2% |
| Total | 58,789,194 | 100% |
| * Percentage of total UK population | ||
Since the UK census relies on self-completion, the composition of the other ethnic group category is not fixed. Analysis by the Office for National Statistics of the 220,000 people in England and Wales who ticked the other ethnic group box in the 2001 census reveals that 53 per cent were born in the Far East, 10 per cent in the UK, 10 per cent in the Middle East, and 7 per cent in Africa. People could write in an ethnic group under the 'other' heading. 26 per cent did not specify an ethnicity, but of the remainder 23 per cent wrote Filipino, 21 per cent Japanese, 11 per cent Vietnamese, 11 per cent Arab, 6 per cent Middle Eastern and 4 per cent North African.
English identity
Controversy surrounding the classification of ethnic groups began as early as 2000, when it was revealed that respondents in Scotland and Northern Ireland would be able to check a box describing themselves as Scottish or Irish, an option not available for English respondents. With an absence of an English tick-box, the only other tickbox available was "white-British", "Irish", or "other". However, if 'English' was written in under the "any other white background" it was not clear whether it would be counted as an ethnic group in same the way as the Welsh. Following criticism, English was included as a tick-box option in the 2011 census.
Welsh identity
It is sometimes claimed that the 2001 census revealed that two-thirds of the population of Wales described themselves as of Welsh nationality. In fact, the 2001 census did not collect any information on nationality. Controversy surrounding the classification of ethnic group began as early as 2000, when it was revealed that respondents in Scotland and Northern Ireland would be able to check a box describing themselves as Scottish or Irish, an option not available for Welsh respondents. Prior to the census, Plaid Cymru backed a petition calling for the inclusion of a Welsh tickbox and for the National Assembly for Wales to have primary law-making powers and its own National Statistics Office. With an absence of a Welsh tickbox, the only other tickbox available was "white-British", "Irish", or "other".
Cornish identity
For the first time in a UK census, those wishing to describe their ethnicity as Cornish were given their own code number (06) on the 2001 UK census form, alongside those for people wishing to describe themselves as English, Welsh, Irish or Scottish. About 34,000 people in Cornwall and 3,500 people in the rest of the UK wrote on their census forms in 2001 that they considered their ethnic group to be Cornish. This represented nearly 7% of the population of Cornwall. Various Cornish organisations were campaigning for the inclusion of the Cornish tick box on the next census in 2011.
See also
 In Spanish: Censo del Reino Unido de 2001 para niños
- Demographics of England from the 2001 United Kingdom census
- Demographics of Scotland
- Jedi census phenomenon
- List of moons
- Census 2001 Ethnic Codes
- National Statistics Socio-economic Classification


